What Drives ROI in Solar + Storage Portfolios in 2026? A Complete Guide
|

A complete guide for asset managers, IPPs, and infrastructure investors navigating portfolio performance in today's market.
In today's energy market, renewable portfolios generate vast amounts of performance data. But data alone doesn't protect revenue. The real advantage comes from understanding how that performance translates into earnings - continuously, clearly, and across the full portfolio.
For a 500 MW solar portfolio with $75M in expected annual revenue, a 2-7% performance gap isn't a rounding error. It's $1.5M to $5.25M walking out the door annually, often unnoticed until an investor raises the question in a quarterly review.
The Missing Link in Renewable Asset Management
Most organizations already have the data. That's what makes this problem so frustrating.
Generation figures sit in monitoring platforms. Financial forecasts live in spreadsheets. Revenue actuals are locked in billing systems. Contract terms are somewhere legal. Every system does its job but none of them talk to each other. And when revenue misses a plan, the investigation that follows is slow and expensive. Operations pull performance data. Finance pulls settlement reports. Asset management cross-references contract terms. By the time the picture comes together, the window to act has closed and the same gap is already building in the next cycle.
What makes this harder is a mismatch that rarely gets named: financial severity and alarm severity don't move together. The most expensive problems are often the quietest. A site running at 94% availability triggers nothing but if its revenue is tracking 8% below plan because a pricing miss compounded an unresolved soiling issue, that silence is costing real money. No one finds out until settlement data arrives weeks later.
For IPPs and infrastructure funds, the pressure compounds further. Owners, O&M providers, and asset managers each operate from a different view of the same portfolio reconciled manually, reported in cycles, arriving stale. Institutional capital has matured alongside the asset class, and the bar has risen with it. Lenders, tax equity partners, and infrastructure funds now expect defensible and auditable reporting, not operational dashboards repurposed as investor communications. The gap shows up precisely when a fund manager asks for a traceable line from portfolio KPI back to source data, and most platforms cannot draw it.
That is the missing link. Not more data. Not another monitoring layer. The intelligence that connects plan to performance to revenue and makes the answer available before it becomes the wrong kind of conversation.
This is exactly the problem enSights.ai was built to solve.
The enSights Approach - Unifying the Three KPIs That Matter
The reason fragmentation is so costly is structural. Every portfolio operates across three dimensions simultaneously and most organizations can only see one or two of them at a time.
Plan Expectations is where every investment begins: the contracted PPA rates, the production forecasts, the storage dispatch assumptions, the budgeted revenue. It's what was promised to lenders and investors. Everything else is measured against it.
Asset Performance is what the portfolio actually did, generation in kilowatt hours, equipment availability, storage behavior, curtailment events, clipping losses. Monitoring platforms produce this data continuously. Most organizations treat it as the finish line. It isn't.
Revenue Outcomes is what the portfolio actually earned: energy prices as they settled against the hedge, market participation results, invoice level revenue. This dimension is almost never reconciled against the other two in real time and that absence is precisely where margin erodes quietly and continuously.
ROI is about understanding variance across all three and having the attribution to explain exactly where the gap came from, every time.
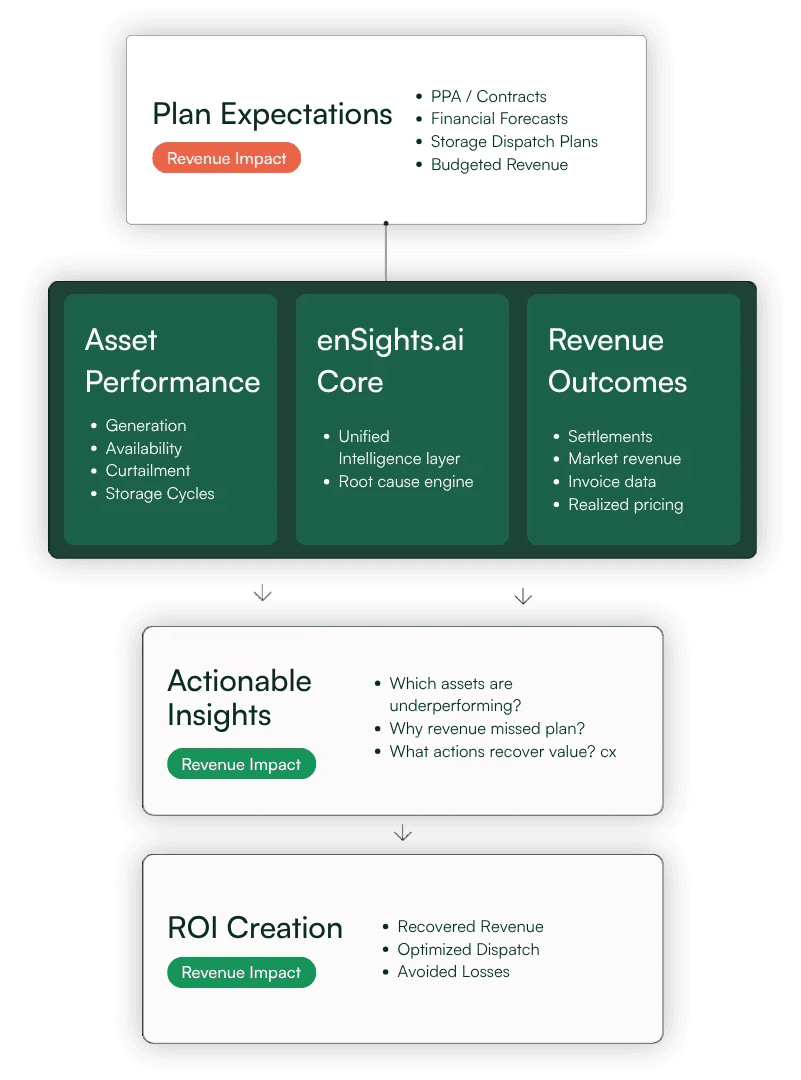
Most organizations recognize themselves somewhere in that model. The data feeding each dimension exists. What's missing is the layer in the middle, the one that connects them, runs the variance analysis, and surfaces what it means for revenue. Closing that gap is where the real work begins.
From Data Exploration to Actionable Intelligence
The conventional approach to portfolio intelligence is investigative. Something looks wrong, so someone goes looking - pulling dashboards, cross referencing spreadsheets, waiting on settlement data. By the time the picture is complete, the cause is historical and the cost is already booked.
enSights inverts that entirely. The platform moves users from exploration to execution through two core capabilities working continuously across the portfolio.
AI-Powered Agents proactively surface issues impacting revenue, identify underperforming assets and their root causes, and recommend specific, prioritized actions before anyone has to go looking. The highest consequence problems reach the right people ranked by financial impact and not just alarm volume.
Conversational Intelligence means users can ask directly:
"Why did revenue miss plan last month?"
"Which sites are driving underperformance right now?"
"Where is the biggest recovery opportunity across the portfolio?"
And receive a direct answer with supporting evidence and prioritized next steps.
This is what makes P50/P90 validation, battery ROI proof, and revenue miss attribution possible at the speed investors and lenders now expect. Tracking actuals against projected generation, contract terms, and revenue assumptions simultaneously is what makes variance attributable before it becomes a difficult conversation.
enSights runs a data cleansing and integrity layer before any insight is surfaced. Every KPI is auditable. Every output traces back to source data. Every conclusion is defensible in front of a lender or investor. That is an architecture decision, and it is what makes the shift from exploration to execution real.
Critically, enSights sits above the specialist tools already running in the stack - SCADA platforms for plant-level monitoring and APM tools for equipment health, consuming their outputs and applying the financial and contractual context that turns those signals into business decisions. The diagnostic stays with the specialist. The revenue consequence is where enSights operates.
The ROI Equation
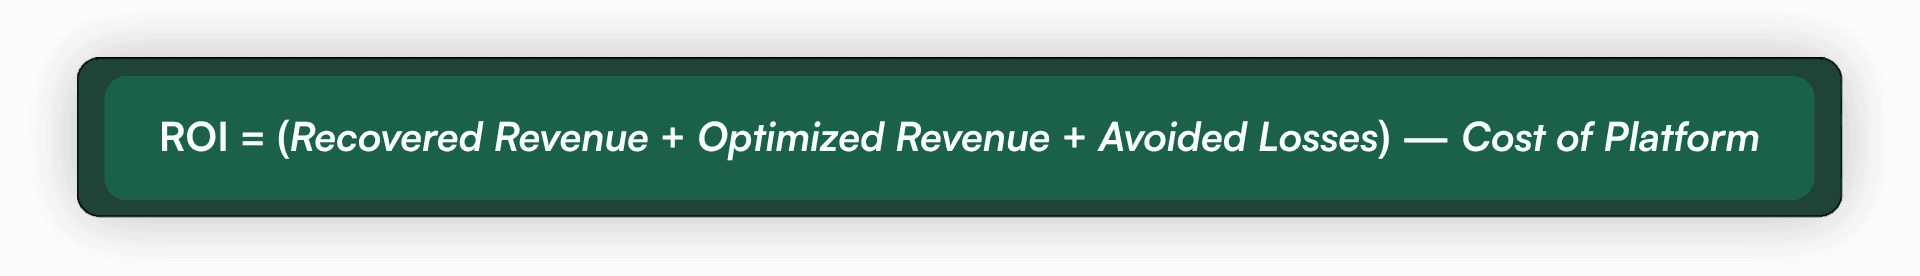
Every renewable portfolio has revenue sitting in four specific places - underperformance that went unresolved, curtailment that could have been predicted, generation dispatched at the wrong price, and storage running against a static schedule rather than a live market signal. The question is never whether the value exists. It is whether the organization has the consolidated view of contracts, financials, and operational data to find it and whether it finds it in time to act.
The table below makes that concrete. For a 500 MW solar portfolio with $75M in expected annual revenue, the four sources of recoverable value, quantified and stacked, look like this:

Asset underperformance recovery closes the gap between what assets are capable of producing and what they actually produce. Curtailment and loss reduction captures value that operational and grid constraints are quietly eroding. Pricing and dispatch optimization ensures generation is sold at the right price at the right time - particularly critical for portfolios with merchant exposure or hybrid storage. Storage optimization connects battery dispatch behavior to the revenue the asset was underwritten to deliver.
At $75M expected annual revenue, a 2 to 7% improvement across these four sources represents $1.5M to $5.25M in recoverable value. The platform investment justifies itself within a quarter. That calculation only becomes actionable when the organization has a consolidated view of contracts, financials, and operational KPIs - the kind of view that turns recoverable value from a theoretical range into a number someone is accountable for capturing.
The recoverable value exists in every portfolio. The determining factor is whether the organization has that consolidated view in time to act on it.
Where ROI Comes From - With Real Examples
1) Solar Portfolio Underperformance Diagnosis
A 500 MW portfolio closes the month at $71M against $75M expected. The gap is 5.3% and an investor inquiry follows. Without connected data, the investigation runs for two weeks and produces an incomplete picture. With unified performance, financial, and revenue data, the attribution takes hours: inverter downtime accounts for 2.1% of the miss, curtailment 1.4%, pricing settlement below the hedge 1.2%, soiling and degradation 0.6%.
The outcome doesn't change. But the ability to explain it - precisely, quickly, and to the right level of detail is entirely different. So is the ability to prevent it from repeating.
2) Storage Revenue Optimization
Most battery ROI shortfalls aren't hardware failures. They're the product of static dispatch schedules that don't respond to live price signals, arbitrage windows that open and close unnoticed, and degradation assumptions so conservative they leave significant revenue uncaptured. The gap between what the asset earned and what it should have earned only becomes visible when technical performance data and financial baseline assumptions sit in the same system — and when someone is looking at both at the same time.
3) Distributed C&I Portfolio
In a distributed commercial and industrial portfolio, revenue leakage is almost never evenly spread. Typically, 15% of sites drive 80% of the loss. The challenge is knowing which 15%, and why, fast enough to do something about it. With unified intelligence, those sites surface immediately, ranked by financial consequence, with root causes identified and actions already assigned.
The intelligence that solves each of these problems is the same, whether the organization is a utility managing regulated returns or an IPP running a diverse merchant book. The context changes. The need for a trusted, connected view of plan, performance, and revenue does not.
What Good Looks Like
The organizations leading on portfolio ROI share three capabilities. They can tie any revenue variance to a specific cause across all three dimensions - quickly, accurately, without a manual investigation. They know in real time which assets are responsible for portfolio outcomes, ranked by financial consequence rather than alarm volume. And they act on intelligence the system generates, rather than insight they have to go find.
This is a different operating model - one where the question shifts from "are my assets performing?" to "do I know exactly why my revenue is what it is, and what do I do about it right now?" The architecture that makes it possible is an intelligence layer above existing IT and OT infrastructure, connecting performance to revenue to contractual obligations without displacing the systems already in place.
Why enSights.ai
That is precisely what enSights is built to be, the intelligence layer that makes it possible, architected from the ground up to deliver it.
The Decision Engine connects directly to OEM and site-level systems across solar, storage, meters, and sensors, multi-vendor and unified without rip-and-replace. Data is continuously enriched with weather signals, market pricing, grid events, and contractual terms. The AI engine ranks every issue by financial impact, operational risk, and SLA obligation, pinpointing losses, clustering related problems, and applying contract rules automatically so the right people are acting on the right problems in the right order. It integrates with CMMS, ERP, billing, and enterprise applications, sitting above the existing stack rather than replacing it.
That intelligence layer translates into five practical capabilities:
Connecting asset performance directly to revenue, contractual, and financial impact
Detecting losses early and prioritizing by financial risk before they compound
Standardizing operational workflows across every asset in the portfolio
Delivering audit-ready reporting that executives can defend in front of a lender or board
Supplying the validated portfolio intelligence that EMS and optimization decisions depend on
Verified customer outcomes include:
7.5% increase in portfolio revenue from real-time issue detection
90% reduction in reporting time, automated, audit-ready exports
Reporting cycles reduced from two weeks to hours
40% faster vendor resolution with SLA-aware, prioritized alerts
50% reduction in O&M analysis time
The numbers speak to something larger than operational efficiency. They represent the difference between a portfolio that reacts to problems and one that stays ahead of them, between reporting that arrives stale and insight that drives decisions in real time.
The gap between what a renewable portfolio was built to earn and what it actually delivers is not inevitable. It is the product of fragmentation - plan, performance, and revenue existing in separate systems, reconciled too slowly, understood too late.
The recoverable value exists in every portfolio. The only question is whether you find it before your next investor call or after it.
Ready to close the gap between what your portfolio was built to earn and what it actually delivers?
Join us for a quick walkthrough of how enSights.ai helps teams better understand portfolio performance and revenue.


How It Works
Solutions
Case Studies
Resources


